You’re a small business owner and you have a great website. You’ve even done some SEO for your site so your company can rank high on Google and Bing.
But how do you know if your website is getting results?
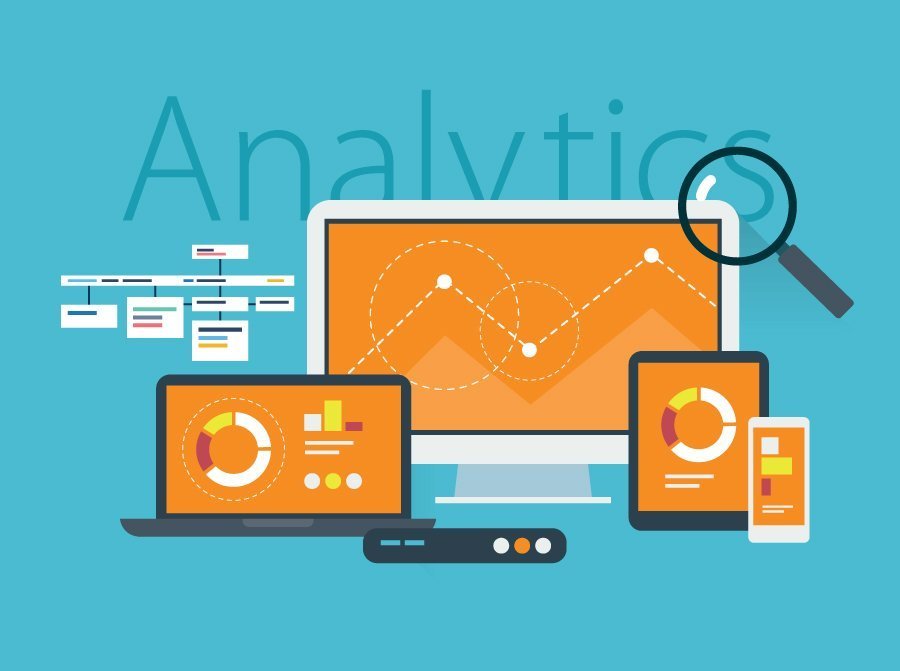
Google has a free service – Google Analytics – that provides you with a few sentences of text (a tracking code) to add to all of your website’s pages to provide you with all sorts of useful information about your site, including:
- How many people are visit your website
- Where your site visitors live
- Whether they’re using a desktop, tablet or cell phone
- Which pages are most popular
- How many of your visitors become customers
But this is just a tiny portion of what Google Analytics can do for you.
This Quick Start Guide will help you sift through Google Analytics to find three of the most common metrics to give you a handle on how your website is performing.

1. Number of Visitors
The number of site visitors you get every week or month is about as basic as it gets – they more visitors you have, the better.

How to View: Click on Audience > Overview.
What to Watch: Once you have the Google Analytics tracking code installed, check your traffic baseline. Over time you’ll then be able to notice how your traffic slowly grows or spikes upward or drops.
What to Do: Slow, steady growth is what you’re shooting for, but if you see big changes in your site’s traffic, pay attention! A big upward spike may correlate to a recent post that got a lot of traction because you did a good job in promoting it on social media. Ask yourself, “What’s causing the increased engagement and how can we recreate it?”
2. How Visitors Are Finding You
Most small business owners don’t know visitors arrive at their website. Are they clicking on links in a Google or Facebook or Twitter? Well, with Google Analytics, your web traffic is divided into channels:
- Organic Search – people click on a Google or Bing search link
- Social – people click on a link on Facebook, Twitter, etc.
- Direct – people type your site’s address into a browser
- Referral – people click on a link on Facebook, Twitter, news article, etc.
- Email – people click on a link in an email
- Paid Search – people click on one of your paid ads

How to View: Click on Acquisition > Overview.
What to Watch: Compare the relative success rate of each of your four traffic channels to determine which is performing best for you – organic keywords for Google and Bing search results, catchy social media posts that link back to your site or offline campaigns that require visitors to type in a specific web address.
What to Do: Tweak your marketing efforts to boost productivity. For instance, if most of your visitors are coming from Twitter referrals, focus your resources there while exploring ways to increase the performance of the other channels. Your goal is to continue to build on your successful traffic sources and troubleshoot your underperforming channels so they start to feed traffic to your site.
3. Time Spent On Your Site
Getting visitors to your web site is half the battle. The other half is keeping them there. That involves great design and compelling content and offers that piques their interest and attracts their attention.

How to View: Click on Behavior > Overview > Bounce Rate or Behavior > Overview > Avg. Time on Page.
What to Watch: Check out your bounce rate – the number of visitors who only go to one page on your site before leaving – and the amount of time a visitor spends on a specific page. The more you investigate what’s happening on individual pages, the more you’ll understand how to interpret the data.
What to Do: Are visitors finding and what they need or quickly leaving in frustration? For example, if a demonstration videos is 3 minutes long, but visitors are only watching 44 seconds, can you shorten the video or is the video host making people click away?
These three metrics are just the beginning of what you can do with Google Analytics. Once you master these, challenge yourself to learn how to run new reports to help you keep your website in tip top shape.
Let Rushminute Help
There’s a lot that goes into creating and maintaining all of your digital properties. We know. We’ve helped dozens of clients in the U.S. strengthen their brands with website makeovers, social media management and digital marketing. If you’re in the process of updating your site or need a “go to web guy” to help you manage your digital properties, Rushminute can help. Contact Rushminute or schedule a virtual cup of coffee and we’ll talk about your vision and how a great website can help you achieve your business goals.
________________
ABOUT THE AUTHOR
Robbie Moore is the founder of Rushminute, a digital marketing agency in Lincoln, Nebraska. With 20+ years of experience in digital marketing, Robbie has worked with dozens of companies and organizations, large and small, around the globe. He also writes extensively about design, development, and business in general.